14.6 ABC Analysis
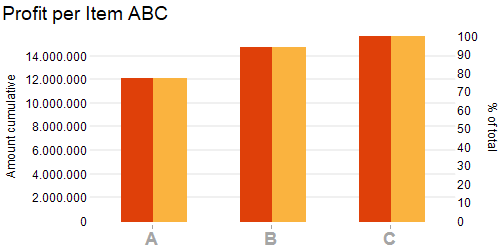
ABC segmentation is a strategic method to categorize your data—such as customers, products, or inventory—into three groups based on their importance to your business:
- A (High Value): The top 20% of items/customers that contribute to 80% of your revenue, profit, or usage.
- B (Moderate Value): The next 30% of items/customers with moderate impact.
- C (Low Value): The remaining 50% that contribute the least.
This principle, inspired by the Pareto rule (80/20), helps you focus your time, resources, and budget on what truly drives your success.
Why Use ABC Segmentation?
ABC segmentation enables you to:
- Prioritize efforts on high-impact areas.
- Reduce costs by optimizing inventory, marketing, or service levels.
- Improve efficiency in procurement, sales, and customer service.
- Maximize profitability by allocating resources where they generate the most return.
With Datashop, you can automatically classify your data into A, B, and C categories and visualize the results—so you can act fast and make informed decisions.
How to create an ABC segmentation
Create an ABC segmentation (see 14.3 How To Create A Segmentation):
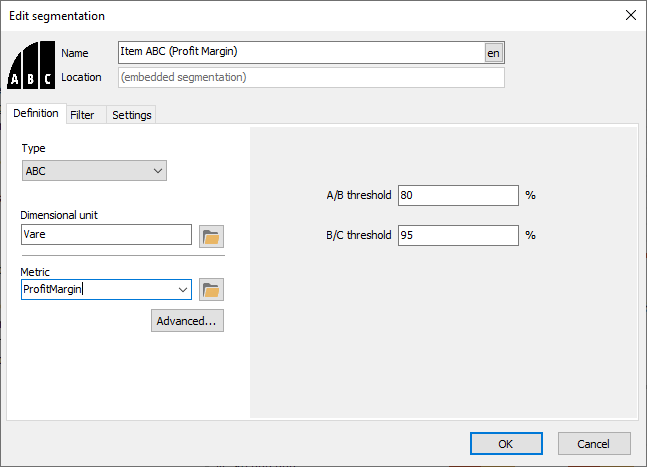
Adjust the two thresholds to suit your purposes. By default the thresholds are 80% and 95%.
Practical Applications
1. Inventory Management
Use ABC segmentation to streamline your stock control:
- A Items: Critical products with high value but low quantity. Monitor closely, maintain safety stock, and reorder frequently. Example: High-end electronics or specialized machinery parts.
- B Items: Moderate-value products. Review periodically and balance stock levels. Example: Mid-range accessories or seasonal goods.
- C Items: Low-cost, high-quantity items. Minimize oversight and use bulk ordering. Example: Office supplies or generic components.
Outcome: Reduce holding costs, avoid stockouts for key items, and free up capital.
2. Customer Management
Segment your customer base to tailor your approach:
- A Customers: Your most valuable clients. Offer personalized service, loyalty rewards, or dedicated support. Example: A wholesale distributor providing priority shipping to top 20% of buyers.
- B Customers: Standard service with occasional promotions.
- C Customers: Automate interactions or use cost-effective service channels.
Outcome: Increase customer retention, boost sales, and enhance satisfaction.
3. Product Portfolio Optimization
Focus your product strategy on what drives revenue:
- A Products: High-margin or best-selling items. Invest in marketing, innovation, or bundling. Example: A fashion retailer promoting its top-selling designer line.
- B Products: Maintain with standard efforts.
- C Products: Consider phasing out, discounting, or bundling with A products.
Outcome: Improve profitability and simplify your offerings.
4. Procurement and Supplier Relations
Optimize your supply chain by categorizing suppliers:
- A Suppliers: Critical partners for high-value items. Build strong relationships and negotiate long-term contracts.
- B Suppliers: Competitive bidding and regular reviews.
- C Suppliers: Minimal engagement; focus on cost savings.
Outcome: Ensure supply chain resilience and reduce procurement risks.
5. Sales and Marketing Efficiency
Allocate your marketing budget where it counts:
- A Customers: Targeted campaigns, exclusive offers, or upselling opportunities.
- B and C Customers: Broad, automated marketing efforts.
Outcome: Higher ROI on marketing spend and improved conversion rates.
6. Warehouse and Logistics
Organize your warehouse for maximum efficiency:
- A Items: Place in easily accessible locations for quick picking.
- C Items: Store in less prime areas to save space.
Outcome: Faster order fulfillment and lower operational costs.
Tips – ABC Analysis
- ABC segmentations can be combined to create decision matrices, e.g. "Profit ABC" vs "Sold Quantity ABC"
- Make sure to adjust the default thresholds to your business and purpose.
Common Issues – ABC Analysis
Problem: The distribution of values to the ABC segments is skewed
- Solution: Make sure you analyze a longer period of time. Short periods can lead to fluctuations in data that makes it misrepresentative of the nature of your business. Also make sure you use the right metrics and choose thresholds wisely with respect to your business and the dimension you are segmenting.