14.5 Pareto Analysis
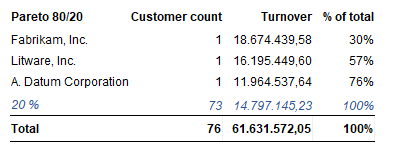
The Pareto analysis is based on a common pattern observed in businesses: That around 80% of profits are generated by 20% of the customers. In the example above the pattern is even more extreme: 80% of profits is generated by 4% of customers (based on demo data).
How it works
Create a Pareto segmentation (see 14.3 How To Create A Segmentation)
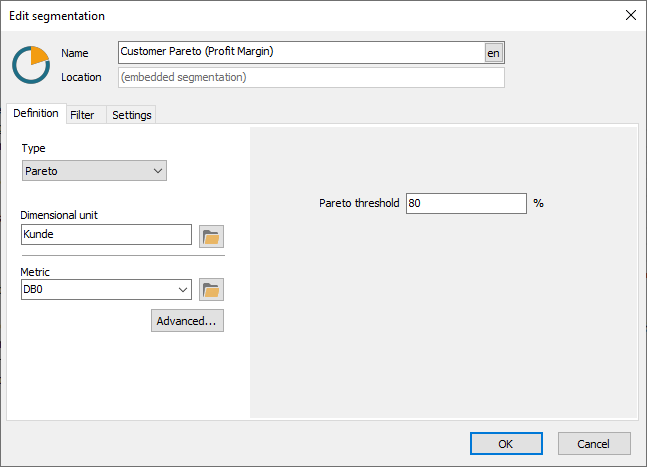
- Select a Metric from the list or by browsing the data model (click button with folder)
- If you know the name of the metric or need to use a metric expression you can just type it directly
Options:
- Pareto threshold: The threshold between the two groups, which is usually 80% but you can choose any value between 1 and 99%.
As you can see it's very simple to create a Pareto segmentation!
Tips – Pareto Analysis
- Use Pareto segmentations to analyze how dependent you are on few customers, vendors and/or items and make a diversification strategy accordingly.